Thursday, May 4, 2017

ArcMap Ground Truthing LULC

Lab Objectives:

By the end of this lab, students should be able to:

  • Construct an unbiased sampling system
  • Locate and identify features using Google Maps street view
  • Calculate the accuracy of a Land Use / Land Cover classification map 

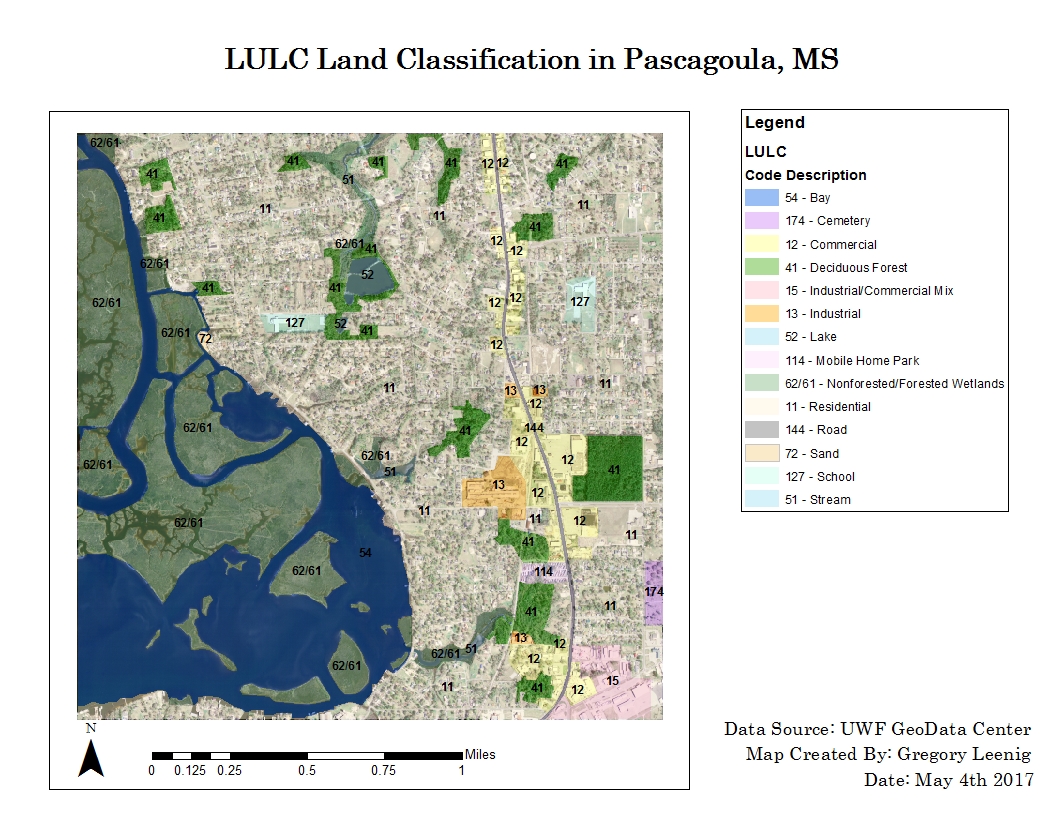
This lab focused on establishing accuracy in land classification using ground truthing. Adding the LULC map from the previous lab in ArcMap, I randomly marked 30 points around the map. Then, using Google Maps and Streetview, I judged whether the feature at each point actually corresponded with the land classification. If it did, I indicated that the point was accurate. If it did not, I indicated the point was inaccurate. After doing this for all 30 points, I calculated the overall accuracy of sample points to land classification. I changed the symbology of the points to green for accurate points and red for inaccurate points. This resulted in an updated LULC map, seen below.


The map above still shows the overall land classifications and LULC codes for Pascagoula, Mississippi, but it is also updated to show the ground truthing and point accuracy.


ArcMap LULC Land Classification

Lab Objectives:

By the end of this lab, students should be able to:

  • Apply recognition elements to Land Use Land Cover (LULC) classification
  • Identify various features using aerial photography
  • Construct a land use / land cover map 

This lab involved identifying features from aerial photography and classifying features into land use classes. The study area is Pascagoula, Mississippi. To classify features, I added a polygon shapefile to ArcMap, which was layed over a TIF true color image of Pascagoula. Using an edit session, I was able to make many polygons of features and then classify those polygons. The polygons were color-coded corresponding to class, and transparency was made so that features could still be seen. These polygons were classified by LULC codes and code descriptions. Polygons were made at a large scale at first (such as classifying the bay, wetlands, and residential areas), but got a little more detailed further into the process (such as classifying commercial, industrial, lakes, etc.). Classifications were made at least to level 2, sometimes level 3.

The map above classifies various land features in the study area. The numbers in the legend are the LULC codes.

Wednesday, May 3, 2017

ERDAS Supervised Classification

Lab Objectives:

By the end of this lab, students should be able to:

  • Create spectral signatures and AOI features 
  • Produce classified images from satellite data 
  • Recognize and eliminate spectral confusion between spectral signatures

This lab involved collecting/creating spectral signatures and classifying them. This is done under supervision (by the creator/user) instead of the computer program. Creating spectral signatures can be done by manually drawing polygons to classify the area of interest (AOI) after an AOI layer is established, and also by growing "seeds" (using spectral euclidean distance and neighborhood). The user can evaluate signatures and appropriate bands by using histogram plots and signature mean plots. These can be used to mitigate spectral confusion between classes.

The image of interest is classified by having the signature file undergo the supervised classification process. Optionally, the user can also create at the same time a distance file image, which shows possible error in the classified image. After this, the user can merge certain classes of the new supervised image if the user wishes. After the classes are merged (or recoded), class names can be established in the recoded image and area of each class can be calculated. The supervised classification process was done during this lab to create land classification of Germantown, Maryland.
The map above shows land classification in the area, such as agriculture, urban, forest, grass, etc.